How To Trade In Equity ?

Here you will get the Basic Methods of Trading in Equites & Bonds, which are supported by well known Equity Trading Guru.

Have You Joined This Blog ?

Please Join This Blog, Before Leaving , It will Make this Blog Reachable to Others Investors. Please Refer This Blog to Your Friends Also.

Sunday, March 27, 2011

Is 2011 the next 1991 in terms of reforms?

India is in a situation similar to that in 1991. "And the government is as committed to reforms as it was then." These are the words of our Prime Minister, Dr. Manmohan Singh. He has assured business houses and leaders that the government is committed to economic reforms. These are much needed to steer the country into the next phase of growth. These reforms are targeted to make the economy more competitive on the global stage. As per Dr. Singh, these reforms would also help in curbing corruption as they would put in place a self-checking vigilance system and help in curbing discretionary powers. In lines with this, he stated that the only way the reforms could be put in place would be to allow the Parliament to function smoothly. He also emphasized that theGoods and Services Tax (GST) system would be operational by 2012.

These words of the PM are welcome in the current scenario. However, people of the country are now looking at how soon these words are converted to action. The people, especially the industrialists, are no longer content with words but are looking forward to seeing the implementation of these promises. And if reforms are as progressive and radical as those made in 1991, then they would definitely be a welcome boost for the growth of the economy. 
Saturday, March 19, 2011

What You Don’t Know About Candlesticks


In writing my latest book, Encyclopedia Of Candlestick Charts, I made some startling discoveries. I used more than 4.7 million candle lines (price bars) for the research with data going back as far as the 1980s in hundreds of stocks, but not all stocks covered the entire period.
Reversals win
One famous technical analyst wrote that continuations perform better than reversals. That would make sense, since it is easier for price to swim with the tide than against it. There is just one problem: That’s wrong. I tested this on thousands of chart patterns and candlesticks with similar results for each. Reversal candlestick patterns outperform continuations 59% to 41% of the time.
One explanation is that the price trend in a candlestick continuation is tired and doesn’t move far. After a reversal, however, traders are excited and power the stock in the new direction, leading to an extended move. Those caught on the wrong side of the trade exit their positions and then jump on the new trend, powering it even more.
I don’t know if that explanation is correct, but I do know that reversals beat continuations.
Trade with the trend
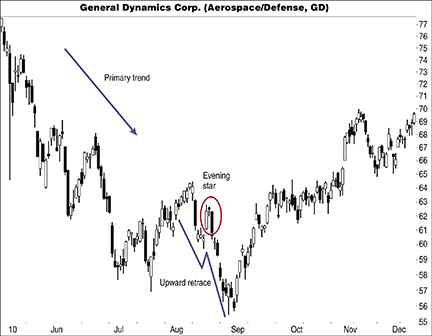
If you’re a serious candlestick player, then you’ll want to know when candles work best. Since we know that reversals work better than continuations, make sure that the breakout direction agrees with the primary trend.
Image 1

Technical Analysis Adapts And Thrives by Michael J. Carr, Cmt, and Amber Hestla


To begin thinking about the philosophy of technical analysis, first of all, we must consider why traders believe it works. The major textbooks in the field acknowledge that technical analysis rests on three basic precepts:
  1. Market action discounts everything.
  2. Prices move in trends.
  3. History repeats itself.
These core beliefs date back at least into the 1800s and are a part of Dow theory. Some would argue that technical analysis can trace its roots to 18th-century Japan and the use of candlestick charts on rice futures contracts. There may be even earlier instances of technical analysis, but these three precepts lie at the core of any study of charts.
It’s all in the charts
Relying on candlestick patterns meant that the trader believed everything he needed to know was in the price chart. This meant that traders were considering the impact of weather on the crop, the possibility of disruptions in supply related to war or epidemics, and any other possible input to supply or demand. Economists quantified this belief into the efficient market hypothesis, and the first precept of technical analysis — “Market action discounts everything” — was recognized as an idea worthy of a Nobel prize.
Trends were a central theme in the idea behind candlestick charts and in the formulation of Dow theory. Technical analysis is grounded in the idea that trends exist and trend reversals dictate a need to change the ongoing investment strategy. Many indicators are designed to identify the direction and strength of a trend, and most research on technical analysis are dedicated to the second precept, “Prices move in trends.”
No investment methodology would work if the third precept, “History repeats itself,” weren’t true. Long-term investors and short-term traders attempt to find characteristics that worked in the past and assume they will work with some reliability in the future. Candlestick traders noticed certain distinctive shapes that occurred over and over again. When point & figure charts became popular, it did so because certain patterns proved to repeat themselves and these patterns offered clues to the future direction of prices. The same was true about bar charts, as repetitive patterns again proved to offer useful trading ideas.

Identifying Cup Formations Early


In my article “Identifying The Cup (With Or Without The Handle),” which appeared in the February 2006 Stocks & Commodities, I introduced a simple mechanical algorithmic method for identifying cup formations (also known as rounding bottoms) in their late phase. The core part of the algorithm was based on the idea of using a virtual grid on the chart. Since then, I have been asked by technical analysts to provide an algorithm for identifying possible cup formations in their early phase. This time I will show you how you can easily use the grid technique for spotting possible cup formations during their development.
The cup formation
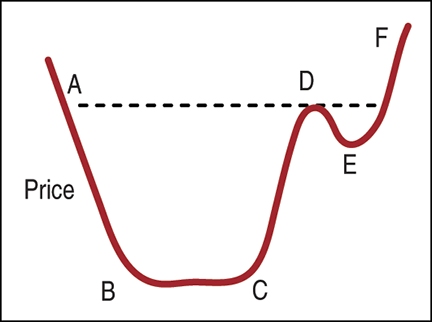
In Figure 1 you can see a typical cup formation. I will not elaborate on the technical details of the cup formation (see “Related reading”). I will say that the identification method I introduced in my previous article on the subject was able to spot cup formations in their late phase (to the right after point C in Figure 1). The goal of the algorithm I will describe is to identify the development of such a formation before or near point C. “But are you sure a cup is being formed at point C?” you might ask. No, we are not. We can’t be sure that a specific formation is going to take place. However, if the price is about to form a cup, it has to form a half-cup before integrating the formation in its entirety. You might want to be informed that the price shows such intentions.
Image 1

Hurst’s Cyclic Analysis by David Hickson


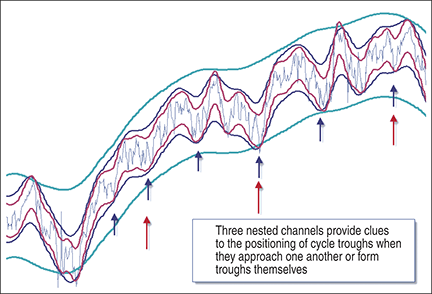
In the 1970s, an American engineer named J.M. Hurst published a thesis about why financial markets move the way they do. His expounded theory was the result of many years of research, and it became known as Hurst’s cyclic theory. Hurst claimed a 90% success rate trading on the basis of his theory, and yet his work has remained largely undiscovered and often misunderstood.
An almost-forgotten theory
Hurst published two seminal works: The Profit Magic Of Stock Transaction Timing, followed a few years later by a workshop-style course that was called the Cyclitec Cycles Course (now available as JM Hurst’s Cycles Course).
A number of enthusiastic advocates, prominent traders, and writers proclaim Hurst as the “father of cyclic analysis” and confirm the efficacy of the theory (including the late Brian Millard, who wrote several books about Hurst’s theory), but why isn’t it better known and more widely used by technical analysts? There are two possible reasons:
  • First, Hurst’s cyclic theory is not easy. While it is beautiful and elegant in its essence, it is not a simple theory to understand or apply. The Cycles Course is more than 1,500 pages long, and most people take several months to work through it.
  • Second, although the theory presented in both the Profit Magic book and the Cycles Course is the same, there is a vitally important distinction between the analysis processes presented in them. Hurst claimed his success on theImage 1 basis of the process presented in the Cycles Course, whereas many people read the Profit Magic book and go no further, with the consequence they never discover the more effective process presented in the Cycles Course.
Today’s K-Wave And Beyond by Koos van der Merwe, Cfp


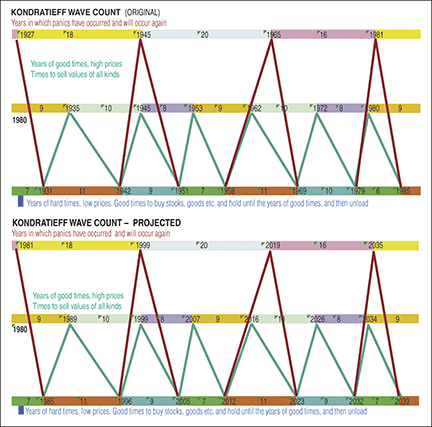
When Nikolai Kondratieff developed his wave theory, he had never heard of technical analysis. He had also never met Ralph Elliott of Elliott wave theory fame, a man who lived in the same generation that he did, a man who expressed in a book he had written about Latin America: “There is a reason for everything and it is one’s duty to discover it.”
In 1946, Ralph Elliott published Nature’s Law: The Secret Of The Universe, and sold the first 1,000 copies quickly to financial analysts. I have often wondered whether he had read about Nicolai Kondratieff and his cyclical theory, which came to international attention in Kondratieff’s 1925 book, The Major Economic Cycles (also translated as Long Wave Cycle). Tragically, Kondratieff’s conclusions were seen as a criticism of Josef Stalin’s intentions for the Soviet economy, causing him to be sentenced to the Soviet gulag and ultimately executed in 1938.
Joseph Schumpeter in his 1939 book Business Cycles was the first to use the term “Kondratieff waves,” which means that Ralph Elliott could have been aware of them. However, there is no evidence that he ever tied his wave counts to the K-wave.

Image 1

Thursday, March 17, 2011

RBI raises interest rates to control inflation

The RBI has continued with its hawkish monetary stance. For the 8th time since March 2010, the central bank increased the repo rate by 0.25%. It now stands at 6.75%. The reverse repo rate also was hiked by another 0.25% to 5.75%. This was mostly in line with market expectations.

So, why another rate hike, you may ask? Well, the disastrous news flashing from Japan has made us forget two very important things. Oil prices and Middle East politics. While oil prices might have eased a bit lately, since Japan is a large oil consumer, they may be back up very soon. High crude prices are of major concern to the central bank. Troubles in Libya and Bahrain have still not eased. And with threats of a nuclear disaster in Japan, the RBI expects that Japan may substitute thermal energy for nuclear power. This may impact fuel prices further.

What does the future hold? With WPI inflation standing at 8% in mid March 2011, the RBI is still off its 7% inflation target. Thus the watchdog has indicated that it will continue with its current anti-inflationary stance until further notice. 

Japan rebuilding will boost steel demand: Mobius

Japan is on the verge of a massive nuclear crisis. And very obviously, the question is being raised about India's nuclear power plans. The limelight is currently focused on the Jaitapur Nuclear Power Project (JNPP). But the government seems to be wearing blinders. Union Environment Minister Jairam Ramesh is usually known for his strong stance on many environmental issues. However, as far as nuclear power is concerned, he seems too relaxed about it.

Let's look at some facts about the Jaitapur project. The plant, with a massive power generating capacity of 10,000 MW, is expected to be commissioned by 2020. It is located near the coastal area of the Arabian Sea inMaharashtra. According to the earthquake hazard zoning of India, it comes under Zone III - a moderate risk zone - on the scale of I to V. However, the Geological Survey of India revealed that the site and the surrounding area experienced 91 tremors between 1985 and 2005, ranging from 2.9 to 6.3 on the Richter scale and the area falls in Zone IV. Whatever the number be, the danger still remains.

Regarding the Jaitapur project, Mr Ramesh has stated that the seismicity aspects have been taken care of. Is seismic zone III or IV not a concern? And how about the tsunami aspects? To that, he seemed unsure if a tsunami probability was factored into the clearance process.

We agree that nuclear power is critical to an energy starved nation like ours. But probably the environment ministry needs to take some important lessons from the Japan crisis. 

Tuesday, March 15, 2011

China goes past US as the world's largest manufacturer

Now you can call this one key validation of Buffett's increasing interest towards markets outside North America. As per reports, China has replaced the US as the world's top manufacturing nation. As per data, China now accounts for 19.8% of the world's manufacturing output, compared with the US at 19.4%.

This shows the increased competitiveness of the dragon nation and the reduced competitiveness of the world's largest economy. We see this as a fundamental shift in the global manufacturing setup, which is unlikely to be reversed in the future.

Anyways, while the US has lost out on size to China, it stands miles ahead when it comes to productivity. China's manufacturing is supported by 100 m employees. The US does it with 89% less number of employees. Now that's a huge gap that China can only dream to cover, also given its ever expanding labour force! 

A heap of money that can push gold to new highs!

It doesn't matter that the yellow metal has had a phenomenal run in the past decade. Factors like excessive money printing, inflation, public unrest and store of value still hold good and hence, gold can still provide attractive returns from here on.

However, a gentleman named Shayne McGuire has taken the discussion about how high gold prices can go to an altogether different level. McGuire, it should be noted, is a fund manager who manages a US$ 330 m gold portfolio at a US based pension fund. In his recent book, McGuire has argued that US$ 10,000 per ounce gold, a jump of more than 7-fold from the current levels, is well within reach!

Indeed, one is bound to dismiss Mr McGuire's bold prediction as pretty outlandish. But we believe he has a pretty strong reason to support the claim. Do you know who manages the world's largest amount of wealth? Well, it is the world's pension funds. As per estimates, global pension assets were believed to be in the ballpark of US$ 31 trillion. To put things in perspective, it is more than twice the GDP that the US, the world's largest economy by far, recorded in recent memory.

Now, here comes the real surprise. As of now, a mere 0.3% of pension assets are invested in gold and gold stocks. Even if this allocation doubles to 0.6%, still a small number by any yardstick, this will represent close to US$ 100 bn of new money to be poured into gold related assets. It would be worth adding for a perspective that that size of the world's largest gold ETF is US$ 55.2 bn. Hence, the push that this new US$ 100 bn can give to gold prices cannot be emphasised enough.

We are not sure whether this will result in gold witnessing a more than 7-fold rise. But the increase nevertheless is certainly going to be extremely meaningful. Do bear in mind that we have not even considered the scenario where the allocation by pension funds towards gold goes up to even higher levels. Imagine what will happen if pension funds view gold as strategically important as other financial assets like real estate and commodities. In such a case, all bets would be off. Thus, have you considered investment in gold yet? If not, do it before it is too late. 

Monday, March 14, 2011

Japan staring at yet another recession?

For Japan, the earthquake and tsunami could not have come at a worse time. Already, the Japanese economy is battling to overcome recession. The yen has been stronger which has hampered exports. And it is burdened with debt that is twice the size of the US$ 5 trillion economy. To make matters worse, the earthquake and tsunami has spawned fears of a nuclear disaster at its nuclear reactors. Plus, power has been disrupted and could take some time before it is fully restored. Factories and oil refineries in the North East region have also been shut down. What this essentially means is that Japan is in the danger of slipping into recession once again. In response Japan's central bank poured a record 12 trillion yen (US$ 146 bn) into the financial system. The Bank of Japan governor has indicated that it is ready to unleash massive liquidity to prevent another prolonged recession in the economy. Japanese interest rates are also at an all time low. Whether an expansionary monetary policy will help revive the fortunes of the world's third largest economy is questionable. So far such policies have certainly not done much for the US and Europe which are also mired in recession.

Thursday, March 10, 2011

The dollar's doomed, suggests world's biggest bond fund manager

That the fate of US Treasuries (government bonds) is headed towards disaster is no secret. The Chinese, amongst the biggest holders of these bonds, have been crying hoarse of its futility for long. The US' ballooning deficit problem is also not unknown.

But when the world's largest bond fund PIMCO sheds all its US Treasury holdings, you know that the problem is grave. Its chief fund manager Bill Gross has been critical of the US government's low interest rate policy. But of late he has dumped all US Treasuries from his portfolio citing very low yields to sustain demand for the paper. He believes that the yields of around 1.5% were at historical lows. Not just that, it is also way below thenominal GDP growth of the US economy projected at 5%.

More importantly, Gross has reiterated interest in emerging market debt. These already accounted for 10% of his portfolio in January 2011. But instead of betting on better sense prevailing within the US Fed, Gross seems more sanguine about the future of conservative central bankers. Is the RBI listening?

Source - Equitymaster Agora Research Private Limited