How To Trade In Equity ?

Here you will get the Basic Methods of Trading in Equites & Bonds, which are supported by well known Equity Trading Guru.

Have You Joined This Blog ?

Please Join This Blog, Before Leaving , It will Make this Blog Reachable to Others Investors. Please Refer This Blog to Your Friends Also.

Saturday, April 16, 2011

Context Is Everything by Gil Morales and Chris Kacher


You do not have to be a Chartered Market Technician to understand how market context can influence the price behavior of stocks. No stock is an island, and how a stock behaves is often a function of the market at large, which in turn is a function of underlying conditions — the context within which any particular market environment is developing.
In the simplest of terms, we know that in a bull market, most stocks go up, and in a bear market, most stocks go down, so this basic idea that market context can provide meaningful clues when studying stock charts is already something we are familiar with when we speak of bull and bear market environments.
It’s the context
While the use of stock charts can be very complex, often the exercise of comparing the price behavior of a stock to a chart of the market as represented by, for example, a major market index such as the Nasdaq Composite Index or the Standard & Poor’s 500 can help you understand a stock’s potential strength. You are also able to better understand why certain price movements are evident in a stock’s overall price chart. When it comes to understanding the price/volume behavior of stocks, context is everything.
A CUP WITH A JAGGED HANDLE. The  Nifty-Spot came down in a series of three very sharp waves. As the Nifty was approaching a top in Jan 2011 at point 1, SCHW was attempting to emerge from a sideways consolidation on brisk volume. Note the powerful countertrend move in SCHW when the Nifty-Spot bottoms at point 4. This could be the deciding factor in purchasing shares of SCHW.

Putting A Stop To It by David Garrard


Investors and traders alike devote a considerable amount of time focusing on what investments to make and what tools to use to make these investments. Novices often spend very little time planning the exit strategy. This is the key difference between seasoned traders and novices. In fact, a greater focus on the exit and less on the entry might make the real difference in your overall trading effectiveness.
Why use stops?
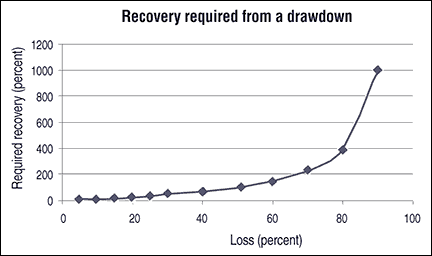
When a loss is posted, we always measure it relative to our original holdings. A similar measure is calculated when a profit is posted. It is important to understand the asymmetry built into a loss/win cycle. Figure 1 shows that if you post a loss of 10%, it will take a percentage gain of 11.1% to recover. Okay, you can live with that as a recovery target. So what happens if you post a loss of 30%? It requires a recovery of 43% above your present net holdings to get back to your original account value. What happens if you lose 80% of your holdings? Well, that will require a 400% price move to recover your losses — not much chance of that in today’s markets. The lesson here is to cut your losses early. That is where the proficient use of stop alerts comes in.
Consistently deploying stops can be painful, but it will allow you to know the maximum limit of your loss in advance, moving you away from later stage fear–based decision-making that can occur when a trade goes against you. It’s already been decided in your trading plan; you exit with a controlled loss.
Image 1
FIGURE 1: RECOVERY FROM A DRAWDOWN. A loss of 10% will take a percentage gain of 11.1% to recover. A loss of 30% requires a recovery of 43%. A loss of 80% of your holdings requires a 400% price move to recover your losses.

Investment Candles by Thomas N. Bulkowski


Investment-grade candlesticks work as reversal or continuation patterns at least two-thirds of the time (66%), and they are plentiful. By “plentiful,” I mean that I sorted a list of 103 candlestick patterns by how often they appeared in the Standard & Poor’s 500 from August 1996 to August 2006. I split the list and discarded the rare ones. That left just 13 candle types, which I describe here.
Configuration and definition
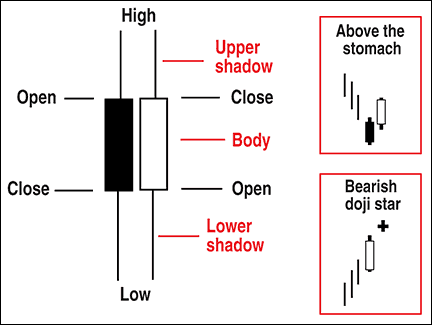
Before I discuss the performers, let’s review the configuration. Figure 1 shows two candlesticks, one black and the other white. The price bar’s high is at the top of the candle, and the low is at the bottom. Between those two extremes are the opening and closing prices, the order of which determines the candle body’s shade. The thin bars at either end are the shadows or wicks, with a body sandwiched in between. A candle need not have a shadow, and the body can be a flat line as in a four-price doji. In those situations, all four prices are the same.
Image 1

VOLUME ZONE OSCILLATOR


In The Volume Zone,” authors Walid Khalil and David Steckler present a new volume zone oscillator that can be easily implemented using AmiBroker Formula Language. A ready-to-use formula for the indicator can be found below.
To use the code, enter the formula in the Afl Editor, then press “Insert indicator.” To modify the averaging period of the volume zone oscillator, right-click on the chart and select “Parameters” from the context menu.