How To Trade In Equity ?

Here you will get the Basic Methods of Trading in Equites & Bonds, which are supported by well known Equity Trading Guru.

Have You Joined This Blog ?

Please Join This Blog, Before Leaving , It will Make this Blog Reachable to Others Investors. Please Refer This Blog to Your Friends Also.

Friday, December 31, 2010


Orkut Happy New Year 2011.

Trade Nifty With www.niftynext.com

Saturday, December 25, 2010

Volatility Skew

Volatility Skew is the difference in the Implied Volatility between Out of the Money Calls and Out of the Money Puts. Very High Skew Numbers could suggest a Strong Bias in the view of the market’s opinion of the Stock/Index. For Example, if the Skew Suddenly Drops, it could suggest that there is a rumor afloat and the market is getting Nervous about the downside of a Stock/Index and thus loading up on Puts and Selling Calls.
There are two types of Skew , Time-Skew and  Strike-Skew. Time skew is a measure of the disparity of option volatility for option contracts with the same price but different expirations. Strike Skew is the measure of the disparity of Options Volatility for Option contacts with different Strikes but the same expiration.
The Skew is a valuable indicator that shows  Option Traders’ biases towards the Stock. Whatever notion one may have Regarding the impending direction of a stock’s Price, it is Prudent to check the Volatility Skew First , and se where the Options Traders are Putting Money.  


Special Thanks to Mr. A. N. Sridhar For this Valuable Works On Volatility Skew.

Thursday, November 25, 2010

Baltic Dry Index Given Positive Cross-Over on Daily Charts !

The Baltic Dry Index (BDI) is a number issued daily by the London-based Baltic Exchange. Not restricted to Baltic Sea countries, the index tracks worldwide international shipping prices of various dry bulk cargoes.
The index provides "an assessment of the price of moving the major raw materials by sea. Taking in 26 shipping routes measured on a timecharter and voyage basis, the index coversHandymax, Panamax, and Capesize dry bulk carriers carrying a range of commodities including coal, iron ore and grain.
The BDI has closed  at 2213 with a gain of +0.60% on 24 Nov 2010. On Daily  price chart ,it has given a Positive –cross over, suggest that the Decline in the  Equity market may  halts in few days. Our Indian Index is declining manily on the news of scams.

Sunday, November 21, 2010

Why Interest Rates Affect the Stock Market?

1.Interest Rates influence stocks prices because they affect corporate profitability , alter valuation relationships, and influence margin Transactions.

2.Interest rates have led stocks prices at major turning points in virtually every recorded business cycle.
3.It is the ROC of interest Rates, rather that their actual level, that affects equity prices.
4.Short-Term  interest rates generally have a greater influence on stocks prices that longer-Term rates.
5.Changes in the Discount rate  offer strong  confirmation that a primary-trend change in money-market prices has taken place.
6.Reversals in the Trend of the discount rate offer early-bird warnings of a change in the primary trend of stock prices.
7.Intermarket relationships can be used to forecast or identify primary-trend reversal in bond prices and yields. 

Nifty @ 14000 and Sensex @ 40000 by 2020

Kondratieff, a Well  Know Russian Economist, who used Whole Sale Price Index in 1926 to Guage the Long Term Wave of World’s Economy, used 40 Years Long Business Cycle.
The Wave has made lows in 1780,1840,1900,1940,2000 and Peaks in  1814,1864,1920 & 1970 respectively.
Our Indices (Nifty & Sensex) has made low in 2000(Also the Kondratieff Wave has made Low in 2000) and after that We have seen one Great BULL-run from 2001-2008 and a Melt-Down from 2008-2009.We are in the Half-Way of Kondratieff Wave. The existing Bull Run will last till 2020 and we may see minor correction in Indian Stocks Market as well in Between and Hope that Nifty Will Touch 14000 and Sensex 40000 by 2020.
After that We may see a Major World Economy Crisis. Possibilities of 3rd-World Ward may not be Ruled out after 2020, when there will be a Shifting of World Market Leader from  USA  to China or Say Asian Countries and a longer period of Higher Interest Rate and High Inflations after 2020 is also expected .
It is prudent to Ride this Nifty’s 14000 Journey with Blue Chips Stocks only  with 80% Load & rest 20% with the new-business opportunity Stocks .

Sunday, October 24, 2010

World's biggest ever IPOs

General Motors Co have filed for an initial public offering of their stock on Wednesday.
The IPO could raise as much as $20 billion, people with knowledge of the preparations have said.
At that level GM could join the list of the biggest IPOs of all time, globally.
On the eve of their listing, a look at the world's biggest-ever IPOs.

Sunday, October 17, 2010

SMOOTHED RSI INVERSE FISHER TRANSFORM

SMOOTHED RSI INVERSE FISHER TRANSFORM is one of the best Trend Reversal Indicators widely used in 1min to EOD price Chart. Scan Version of this Amibroker-AFL will be made available shortely.

Moving Averages, First Principles

Of all the technical indicators, moving averages are perhaps the most widely used and misunderstood. Incorrectly applied, as is usually the case, they may be responsible for more losses than any other indicator. Correctly applied, however, they can be the most versatile and powerful tools available. The reasons for failure? First, a poor understanding of how stock prices move, and second, a poor understanding of the properties of moving averages.
It is important to note that if the user does not attempt to understand how prices move, then applying any indicator is a haphazard affair. Indicators tend to be developed by trial and error, and without a clear understanding of how they work, using them can lead to disappointing -- and disastrous -- results.
FIGURE 1: DAILY DIFFERENCES. The differences between one day's closing price and the next is plotted for IBM stock over a four-month period.
STOCK PRICE MOVEMENTThe point-to-point movement model is based partly on the one put forward by analyst J.M. Hurst a number of years ago and partly on my own research. In this model, stock movement is considered to be composed of random point-to-point movement and complex cyclic movement. Point-to-point movement is simply a generalization of the sampling interval and refers to the change between one data point and the next, such as "tick-to-tick," "day-to-day," and "week-to-week," as well as others.
POINT-TO-POINT MOVEMENT
Point-to-point movement is easily extracted from stock data by most technical analysis programs. An indicator is usually available that will give the difference between successive points; if not, such an indicator can often be created within the program. As an alternative, stock price data can be imported into a spreadsheet and the successive differences calculated and plotted. This method is useful, since a spreadsheet function will be available to determine the standard deviation of these differences, a valuable quantity that will be discussed later.
The point-to-point differences can have negative, positive, or zero (no change from the previous point) values. A plot of these daily differences over a short period can be seen in Figure 1. The vertical grids are spaced at 10-day intervals, and the vertical scale is in dollars. A sequence of changes in the same direction is indicated by the plot remaining on the same side of the zero line.
A close inspection of the differences reveals that the longest such sequence occurred between June 18 and July 2, 1998, and extended to eight successive rises. The extreme peaks and troughs have no meaning other than they are the maximum changes recorded. In general, a sequence of more than 10 successive moves in the same direction in a stock almost never occurs.

Trading Andrews Lines

About 20 years ago, I first learned about the work of Alan Andrews and his pitchfork charting technique. The concept seemed fairly straightforward; you start with a sequence of three turning points identified as the most significant highs and lows of the time frame you are working in. This can be either a high (A), low (B), high (C), or a low (A), high (B), low (C). (See Figure 1.) Next, you draw a line between the last two turning points (B and C), find the midpoint of that line (D) and draw a line from A, through D, and extend it to the right as far as needed (E).

FIGURE 1: PITCHFORK CONSTRUCTION. From low A, draw a line through the midpoint of BC, extending it to E.

Then, extend the BC line both up and down by a distance equal to B-C in each direction, the endpoints of which I can label as B1 and C1. Now, draw lines from B1 and C1 to the right and each parallel to the ADE line. This forms a type of angled pitchfork set of lines where the lines from B1, D, and C1 are all parallel to each other. Additional parallel lines of B2 and C2 and so forth can be added, but I've never bothered with the extensions of even B1 and C1.

As I understood it, Andrews' basic tenet was that prices would tend to move out from C along either the C parallel line or between the "prongs" of the pitchfork -- that is, between the C line and the D line. That way, you would be able to determine how prices would move.
That's all I heard about Alan Andrews. The idea intrigued me, though, and I eventually set out to understand and expand upon the concept. I hope this will help you understand the ways the markets move.
In a wonderfully simple universe, the reaction from point C should come back toward line ADE and touch it at a point roughly equal in distance from D as is A. If I mark this as intersection point E, then in a perfectly symmetrical situation, the distance from D to E would be equal to the distance from D to A.
You simply continue the process as the market action unfolds and confirms new turning points. In the example in Figure 2, you would find the midpoint between C and E, mark it as F, and then draw a line from B through F and extend it to the right by a distance equal to B-F. I would label the end as point G. This new point G now becomes my next ideal target in both price and time.
You'll be surprised at how often this technique can actually identify a point in both time and price, when the market has a high probability of turning. When it doesn't behave in this perfectly symmetrical fashion, things become intriguing. With careful study, the market action around this first principle will begin to hint at what it's going to do next.

Friday, October 8, 2010

15- Minutes Pre-Market Call Auction at NSE/BSE Fro 18 Oct 2010

NSE/BSE will start pre-market call Auctions for 15 mins from 18 Oct 2010 to find the fair value of Index, in line with the many International Markets ,l ike NSE, Nasdaq  LSE etc. The Time will be 9.00-9.15 AM. Investors will be able to place BUY and SELL orders for Nifty &  Sensex Stocks/Indices for a period of 7 Mins  (9.00-9.07am).During this 7 min, no Trade will be executed. T he Exchange will  discover “Indicative Price” for these Stocks and Indicative Index Levels.
The Exchange will halt order taking between 9.07-9.08 to check any market manipulation. At 9.12AM orders will be matched and opening price for Stocks /Index will be discovers. The opening price will be the Price at which maximum amount of shares can be Traded and Normal Trading will starts at 9.15 AM on NSE/BSE.

Thursday, October 7, 2010

IMF inks India’s 2010 Growth @ 9.7%

The International Monetery  Fund  has raised its India growth forecast for 2010 to 9.7%, up from the July forecast of 9.4%. Asia’s third largest economy(India) is projected to slow down to 8.4% in 2011.China’s likely to grow by 10.5% in 2010 while Asian economy  will likely to grow at  the rate of 9.5%.
Leading Indicators-the production manufacturing Index and measures f business and consumer confidence are continue to point up. The World economy , led by emerging markets, is forecast to grow by 4.8% in 2010 before falling to 4.2% next year and a sharper global slowdown is unlikely.

Saturday, October 2, 2010

Nifty Next- Bulls May March Ahead

1. VIX drops by -3.70% to 21.43 on 01 Oct 2010. Investors are confidence now.
2. Huge FII Inflow in 2010 in equity market (INR 89115.70 Cr)
3. Nifty is Trading at PE-25.54
4. Auto  Sales are on Fast Tract.(Dow Theory supports that for a secular Bull Run.Auto Sector must    have to Out-Perform)
5. GDP growth Figure set to rise @ 9.0%.(Thanks to new series of WPI,Base year changed to 2004-2005)
6.  Goldman  Sachs rasied  Indian economic Growth Forecast.
7. Micro-Finance Institutions are tapping the Capital Markets, will boost Rural India.(ITC,  Micro Max-Mobile Co-Yet to List, Home appliances will be the most gainer)
Visit www.niftynext.com for best Nifty Trading Tips. Call # 880 2230 836.

Sunday, September 19, 2010

When To Enter And Exit Trades-Using Clear method-by Ron Black

Clear method, a way to determine the direction of short-term price swings. The method identifies the direction of the current price swing and the precise day the swing direction changes. It requires no calculation and has no delay. It is applicable to all stocks, commodities, and indexes in any time frame.
We saw how, unlike most technical indicators, the Clear method does not use the open or the close for its analysis. Instead, it uses the range of the daily price bar as the measure of price uncertainty. I looked at how price bars are simplified distributions. Since prices are distributed, we consider the price to be different only if the two distributions (price bars) do not overlap; the bars must be “clear” of one another.
Movement of the price bar
Figure 1 shows the Clear method in action, showing the up swings, down swings, and the “clears” that define the changes in direction. In this article, I will look at how the method defines the only three things price can do: move in the direction of the swing, not move, and reverse swing direction. When the price is not moving, there is noise. I will take a brief look at the noise percentage as a measure of continuous directionality. Finally, I will look at a way you can use noise to decide when to enter and exit trades.

Monday, September 13, 2010

Mukesh Ambani to be World’s Richest in 2014

The Fobres Magazine has forcasted in its recent Report “What Happens Next-Our Outlook Ahead” that Indian Bussiness Tycoon Mukesh Ambani could be the richest man on Earth in 2014.
What It Means for Reliance Industries Share Price- Reliance Industiries is now Quoting at 958 INR per Share on NSE. If we consider the above report and goes for Valuation of RIL by 2014, It must be quoting around 3500-3900 by 2014 or another instance of Stocks-Splits or Bonous may be considered by the RIL Board by 2014-2015.
So having RIL shares around 960 INR will be a wisefull decision for the Target of 3500-3900 over 3 years.

Saturday, September 11, 2010

IIP Data July 2010-Chears to Indian Equity Traders !

1.IIP Data expanded 13.76% in July 2010, compared to 5.76% growth in June, beating the Street’s expectation of 7-8%.
2.Inflation rasies to 9.97% in July.
3.Manufacturing, which generates exployments has been doing well, Grown by 15%.
4.Capital Goods contributed mostly to this Growth in July.All Inventories have used.
5.RBI may rise Rates again to tame the Inflations.Creatit growth is yet to Pick-Up.
6.We are on the Track to achieve the 8.5% Growth Rate.


The Author is Senior Chartist of M/S Durgapur Holdings( www.niftynext.blogspot.com). She may be contacted at niftynext@gmail.comOr + 91 880 2230 836.

Wednesday, September 1, 2010

How to TRADE ON our calls?

Example :

Buy NIFTY above 4400 target 4445 – 4485 SL 4380

*       Always take entry after above price. (Technically we call it is breakout level)
*       Let nifty to cross 4400 then if sustain for 1-3 minutes then Buy.
*       When 1st target achieved, book 50% profit, revise SL to Buy Price.
*       When 2nd target achieved book 100% profit, revise SL to 1st target.

Or

You can trail Stop loss and enjoy good profit, like this
*       Always take entry after above price. (Technically we call it is breakout level)
*       Let nifty to cross 4400 then if sustain for 1-3 minutes then Buy.
*       When 1st target achieved, revise SL to Buy Price.
*       When 2nd target achieved book revise SL to 1st target.(HUGE PROFIT)

Similarly follow above instructions for Sell Calls.
Similarly follow above instructions for all categories of products means, Cash Calls,  Nifty ,Bank Nifty,CNXIT Futures Calls( Intraday & Delivery ).


Sunday, August 22, 2010

Trading, Time Frames, And Trends

Technical analysis is used to forecast future price trends. Many technical tools focus on the task of defining a trend. Not addressed adequately, however, is the issue of what kind of trend is being defined. Is it long term, medium term, or short term? Time frames are important for traders. After you establish the trend of the time frame you trade in, the next step is to relate that to the trend of the next larger time frame. For example, if you established the direction of the trend on a daily chart, you would look at a weekly one to confirm the direction of the trend. Understanding time frames will make sense of trends between two time frames, especially when there are opposing trends. When that is achieved, you can improve your market forecasts.

Time frame approach defined
It is a common practice for traders to look at markets in a single time frame. Traders typically focus only on the time frame they trade in, be it the hourly or daily charts. With the benefit of modern technology, charts are now available on time frames ranging from tick charts to five-minute ones to hourly, daily, weekly, monthly, and beyond.
The time frame approach is a technique where you analyze a market over two or more time frames. If you normally analyze a five-minute chart, you should analyze the hourly one as well. If you are a daily chart trader, you should analyze the weekly or even the monthly for comparison. This will help you better forecast the market and trade more effectively.
FIGURE 1: WEEKLY CHART OF STRAITS TIMES INDEX (STI) FROM MARCH 2006 TO MARCH 2009. After a bullish rally in 2007, the weekly chart displayed a reversal in trend in 2009 when the 10-period EMA crossed below the 40-period EMA.

Cloudbanks by Thomas N. Bulkowski

During the 30 years I have spent investing in or trading the markets, I have discovered many chart patterns, including pipes, horns, and barrs. Here’s another, which I call the cloudbank pattern. Investing in cloudbanks gives you the opportunity to make a lot of money if you are patient and price rises back into the clouds.

Identification guidelines
Figure 1 shows an idealized example of a cloudbank chart pattern. It begins with price moving horizontally for several years, but the duration can vary from pattern to pattern. The shortest length in my study was five months and the longest was almost 17 years, with the average duration being 2.75 years. The cloudbank is nothing more than a ceiling of overhead resistance
The bottom of the cloudbank should have a horizontal base, but often it’s irregularly shaped. By “irregularly,” I mean it is uneven with several valleys approaching the same price separated by large distances. Sometimes, price pokes through the base, but that’s fine. Ignore cloud tops because they aren’t important.

After the cloudbank comes a swift decline to the lowest low that averages 56% for those patterns in which price returned to the cloudbank. Following a V-shaped bottom, price rises, and it takes about a year to return to the cloudbank.
Examples
Often, a bear market causes the drop out of the clouds, but not always. Let’s look at some examples to watch the pattern take shape

Tuesday, August 17, 2010

Emerging markets V/S Developed markets

The US economy has been growing at a turtle's pace. Japan has not been too far behind. Europe is almost flat with a few exceptions. China's stellar growth is expected to slow down. But Templeton's Mark Mobius feels that the global economic recovery is "well in place". According to him, the growth in the BRIC countries coupled with Turkey and South Africa will more than offset the slowdown in the developed world. While China has slowed down, but a growth of 10% is still not such a bad thing.
As per Mobius' peers too, it would be the emerging markets that would lead the economic recovery across the world. This is reflected in the performance of the markets as well given that the
MSCI (Morgan Stanley Composite Index) for Emerging markets has outperformed the developed markets in recent times. 

India to become the world's fastest growing economy

It is becoming more and more obvious how gung-ho the rest of the world is on emerging markets, especially China and India. And it is now also becoming increasingly evident that the scales might tip in favour of India very soon. A recent report by Morgan Stanley helps confirm this view. A sterling demographic dividend. Continuing structural reform. Globalisation. All these factors will help India accelerate its growth rate to 9 to 9.5% over 2013-15. This even as China will cool down to a more modest 8% by 2015. It expects globalisation to give additional job opportunities to Indians. Additional capital to augment rising domestic savings and additional know-how are other collateral benefits of globalisation India will enjoy going forward. In light of these factors, the report expects India to become the world's fastest growing economy by 2013-15. Gazing into the crystal ball is always a tricky exercise. We must admit though that India has a lot of things going for it currently. Especially relative to many other large countries around the world. 

USA-Unemployment Rate

Unemployment is the number one thing in the minds of most economists and investors when it comes to the US these days. And according to the world's most influential bonds fund manager, Bill Gross there is no solution in sight. Bill Gross believes the new 'normal' unemployment rate will be 7% instead of 4%. Hence, the government should spend tens of billions of dollars on new infrastructure projects to put people to work and stimulate demand.
In his own words, "Current policies have specifically promoted consumption as opposed to investment. We need some type of government-oriented policy that promotes infrastructure, that promotes re-education, that promotes the green energy that is specifically directed as opposed to pushing money into the consumption hole." We must point out though that there is an underlying danger in this approach.
Government spending on infrastructure might result in a lot of wasteful expenditure - not the best use of precious capital. 

My India My New Hope!

The fate of the PIIGS (European nations now infamous for their huge debt burdens) may have come as a rude shock to investors in Europe. But the economy which is the biggest investor in US Treasuries does not think so. In fact China is now supposedly more bullish on the Euro zone than on the US.
The Chinese central bank has been buying more of Euro bonds rather than selling the same. As against this its sale of US Treasuries over the past few months has been well documented. Japanese bonds too have found takers in China. This may seem to be just a case of diversification of investments. However, the underlying fact may be of huge concern to the US Fed.
Asian central banks, holding around 60% of the world's foreign exchange reserves, are turning away from the dollar. The world's reserve currency is in dire need of support.

MFs using all means to get new accounts

The Indian mutual fund industry has been facing tough times of late. Fund houses are finding it tough to get new clients into their system. This is given that the SEBI has knocked off the fees that distributors used to get from selling mutual funds (under the garb of entry loads). In these times thus, mutual fund companies are restoring to all means to get in new accounts. One step these companies have taken is to tap their existing clients for more funds. 
Leading the ploy are bank-sponsored fund houses. These are increasingly becoming dependent on their bank sponsors or in-house partners to help garner a tidy collection. And the results are there for everyone to see. These bank-sponsored fund houses are witnessing inflows of around 40-70% of new fund offer (NFO) collections coming from the sponsor bank's customers. 

The Grand Show Cairn India !

Oil exploration is not an easy job. In fact, it is one of the most complex operations in the world. One that requires tremendous experience, sound knowledge and management depth. What is more, world over, governments insist on prior experience before companies are even allowed to explore. Take the case of the recent BP oil spill. Despite having years of experience in the oil exploration industry, BP became embroiled in the world's biggest oil spill in history. 
So, it was mystifying when the Anil Agarwal owned Vedanta Resources announced its intention of acquiring 51% stake in Cairn India. After all Cairn India is into oil exploration. And Vedanta, which is into metals and mining, has zero exposure to the oil industry. What also works against Vedanta Resources is its questionable management. The company has already been accused of 'having contempt for the law' in its recent bid to build a bauxite mine in Orissa. 
This more than ever highlights how important quality of management is. A good or bad management (as the case may be) may be a game changer in terms of where a particular company's fortunes are headed. One cannot put a number to management quality. But the track record of the company and what the management intends to do to steer the growth of the company forward is important. Justifying a particular strategy by highlighting the huge potential that India has is one thing. But are these decisions taken by the managements in the interest of the companies and their shareholders? Many a time investors give a lot of importance to how high the share price of a company is likely to go. No heed is paid to the managements' intentions and capabilities. And that could be the biggest blunder that shareholders and investors make. 

Monday, August 16, 2010

SEBI New Rule-Idel Cash of Clients with Brokers

Amongst all the vested interests that are out to get hold of his money, the lay investor has one really good friend in the stock markets. We are talking about none other than SEBI. This market regulator has been really aggressive in making the investment environment much safer for Indian retail investors over the past couple of years. And it has just made one more such move. 

SEBI has now made it mandatory for stock brokers to return their clients' unutilised cash lying idle with them at the end of every month or quarter. The brokers will also have to send out a statement showing clients the status of their funds at similar intervals. Further, if you as a customer choose to withdraw your funds from your broker, he will now have to transfer the same to you within one working day. This in contrast to the earlier norm of 2-3 days. There have been cases where many brokers have unscrupulously misused customer funds without their knowledge. These new rules will go a long way in putting a check on such practices. 

Suzlon & Relaicne Communication-Another Satyam Story?

"Power tends to corrupt, and absolute power corrupts absolutely," said Lord Acton, an English historian. Nothing can be closer to truth than the way powerful CEOs behave. These are the men managing big (and supposedly respectable) companies. 

They suffer from what psychologists call the 'paradox of power'. The very traits that helped these leaders get control in the first place disappear once they rise to power. They become impulsive, reckless and rude. 

Take the case of these two 'big' Indian companies. When times were good, they resorted to financial engineering to prop their growth numbers. Investors thought these were great companies and could do no wrong. Ironically, even the top men in these companies thought the same - they could do no wrong! They spent big money in making wrong acquisitions, and went more aggressive than their financial strength would have supported. 

They had wind in their sails, and thought that they connected very well with their stakeholders! After all, whatever decisions they took were applauded by the markets. 

Well, those were the heydays of the pre-crisis period. After the crisis struck, not only did these companies lose business big time, their balance sheets started bleeding profusely. The wind was gone, the storm was here. 

And the people who paid the biggest price were the minority investors. Those who were managing these big companies and had made those big bad decisions when the times were good, were still doing well! 

Well, we are talking about companies like Suzlon and Reliance Communications. These still are widely-known companies in their respective businesses. But then, investors might remember them for their reckless pursuit of growth rather than any shareholder friendliness. These are clear cases of how a management's overconfidence can hurt shareholder returns, and hurt big time! 

After 64 years of independence, challenges lie ahead of India

Sixty-four years after independence, the baggage of colonialism, the socialist experiment and the 'Hindu' rate of growth is well and truly behind us. What lie ahead are great opportunities and challenges in equal measure. 

In an interview to CNBC, Dr. Amit Mitra of FICCI highlighted a few key challenges. One of the most important issues is primary education. Also, we need to look at agricultural productivity and supply chain efficiency. About 40% of food produce is wasted. That is unacceptable. On the growth front, we need two things. First is 'capital formation' - the channeling of savings to capital goods. Second is developing indigenous technology instead of always depending on imports. Of course, inclusive and better quality education right from the primarily level is a must. We agree. The need of the hour is systemic changes that increase India's ability to create further 'growth' capacity. 

More Indians buying gold as investment than jewellery

In India, gold has traditionally been used for making jewellery. But this now seems to be changing. This is becausefor the first time, Indians have converted proportionately more gold into investment than into jewellery.The World Gold Council figures suggest that in the case of net retail investment, there was a 19% rise for the first quarter of 2010. This is more than the 18% figure for jewellery. 

One can obviously conclude that the part of the reason for the same is the impact of the global slowdown. This has resulted in a flight to gold as a safe investment haven. How long will this trend continue will depend on how long the world economy remains in trouble! 

Where do rich Indians invest their wealth?

The Wall Street Journal carries an interesting report on how India's rich invest their money. The report talks about a recent study done by Capgemini and Merrill Lynch Wealth Management, who found that India has around 130,000 people with investable assets of more than US$ 1 m. And where do these rich invest their money? The study found that a bulk of it is in stocks, bonds, and mutual funds. In fact, around 50% of their funds are parked in these assets. Out of the rest, around 50% is into real estate, including real estate funds. And then come other avenues like private equity, art, foreign funds, and gold. 

Such a diversification is not really possible for investors who do not have so much surplus funds to invest. You might be one of them. For you, it would make sense to stick with carefully selected stocks and mutual funds, as well as gold. But then, apart from just investing, you also need to closely track your portfolio of stocks and mutual funds. The rich do this through their relationship managers. What about you? 

Who'll lead Infosys after Mr. Murthy retires?

Anyways, one aberration that we can talk about in this world of 'powerful' CEOs and Chairmen is Mr. N.R.Narayana Murthy, the chairman of Infosys. Off late, the big question that has risen is - Who will be the next Infosys Chairman after Mr. Murthy retires next year? 

Well, a committee headed by Jeffrey Lehman (US scholar and Infosys' independent director) has been formed to carry out this task. And it is not an easy task. The selected person has to step into the boots of Mr. Murthy. And these are big boots of someone who has been responsible for shaping the face of the Indian IT industry. As per Mr. Lehmann, the main criterion is that the person should have a sound knowledge of both the IT industry as well as of Infosys. Nationality is not a bar. It could be anyone from within or even outside Infosys. However, at the end it would be someone who would be accepted by Mr. Murthy as well as the shareholders and stakeholders of Infosys. 

Who do you think is the right person to replace Mr. Murthy?

Saturday, August 14, 2010

Individual Momentum Indicators

The KST can be constructed for any time frame, from intraday to primary .
The KST is calculated from the smoothed ROC of four time spans , each of which is weighted according to the length of time.
Long-Term ,Short-term and intermediate KST’s can be combined on one chart to reflect the Market Cycle Model.
The KST lends itself to numerous momentum-interpretive techniques and can successfully be applied to relative strength analysis.
The +DI and _DI  means postive and negative short-term direction.
When the raw or smoothed Dis cross, they trigger buy and sell momentum signals.
The ADX measures the directional movment of a trend.
A rising ADX indicates an increase in directional movment and vice versa.
Qwhen the ADX reverses direction from a high reading, the prevailing trend is likely to change.
The parabolic is a stop-loss system.
The parabolic was orginallydesigned as a stop and reversal method.It is better used as an exit mechanism due to the large risk oftern associated with the initation of a position based on an initial parabolic stop.

Momentum

Momentum is a generic term embracing many different types of oscillators.
Momnentum measures the rate at which prices rise or fall and gives usful indication of latnet strength or weakness in a prce trend. This is because prices usually rise at their fastest pace well ahead of their peak .
Since markets generally spend m,ore time in a rising than a falling phase, the lead characteristic of mementum indicators is normally greater during rallies than during reactions.
Oscillators reflect market sentiment and have different charactersistsics in primary bull and bear markets.
There are two basic methods of interpreting momentum: momentum characteristics and momentun trend reversal
Momentum singlas should always be used in conjunction with a trend-reversal  signal by the actual price.

Trendlines-Part

Trendlines are perhaps the esiest technical tool to understand, but considerable experimentatin and practise are requied before the art of imterpreting them can be successfully mastered.
Trendline violations signal either a temporary interruption or a reversal in the prevailing trend. It is necessary to refer to other pieces of technical evidence to determine which is being signalted .
The significance of trendlines is a  function of their length, the number of times they have been touched or approached, and the steepness of the angle of ascent or descent.
A good trendline reflects the underlying trend and represents an imprortant support and resistance zone. Extended trendlines are an important concept and should not be overlloked.Exhaustionbreaks often possess good predicitive power. 

Characteristics of Simple Moving Averages(MA)

An MA is a smoothed version of a trend and the average itself is an area of support and resistance.In a rising market , price reactions are often reversed as they find support in the area of the MA, similarly , a rally in a declinating market often meets resistance at an MA and turns down. The more times an MA has been touched,that is , when it  acts as a support or resistance area.the greater the signficance when it is v iolated.
A carefully  chosen MA sghould reflect the underlying trend, its violation therefore warns that a change in trend may already have taken place. If the MA is flat or has already changed direction, its violation is fairly conclusive proof that the previous trend has reversed.
If the violating occurs while the MA is still procdding sharply in the direction of the prevailing trend, this should be treated as a preliminary warning that a trend reversal has taken place. Confirmation should await a flattening in the angle of ascent or descent, a change in direction in the MA itself, or alternative technical sources. The crossover of a moving average with a sharp angle of ascent or descent is akin to the vilation of a trendline with a sharp angle.
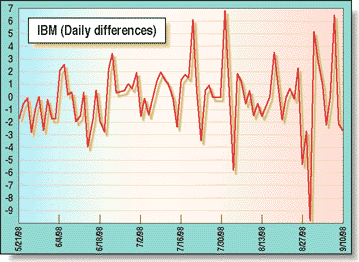
signal. For instance, the vi olation of a 18-month MA is a substantially more important than the crossover of a 30-day MA.
Reversal in the direction if an MA are ususlly more reliable than an MA  crossover. In instances in which a change in directions occurs close to a Generally spaking, thelonger the time span covered by an MA, the greater the significance ofa crossover market turning point, a very powerful and reliable signal is given.
In a nut-shell, think of an average as a type of moving trendline that obtains its significance from its length(time span) , the numbur of times it has been touched or approached, and its angle of ascent or descent.

RBI & SEBI to Strengthen the Indian Capital Market

The RBI, like the stock market regulator SEBI, is getting strict with the wrongdoers. This time it is the turn of holding companies. As per a leading business daily, the RBI has introduced a regulation that will limit the amount that can be borrowed by core investment companies that operate as holding companies. We see this impacting several large business houses. This is given that this regulation will restrict borrowings by several large companies and force them to revamp their ownership structures. RBI has also said that holding companies must ensure that their outside liabilities do not exceed 2.5 times their adjusted net worth. This restricts such companies from borrowing outside the group. 

Reason Behind The Sky-Jump of Tata Motors Stocks

The world's cheapest car will soon be available with you having to form a queue. We are talking about Tata's Nano. Currently the waiting time to get a car from the date of booking ranges anywhere between one to five months. The reason - constraints in production. Orders for the Nano have been pouring in and the company has been trying to meet them. But as of now there are still 1.5 lakh bookings waiting to receive the car. The company has started to step up production at the Gujarat factory and is aiming to do away with the entire booking period. Soon a customer will be able to go to a Tata showroom and drive out in the Nano on the very same day. This would be rolled out from Maharashtra and will soon follow in other states. 

SEBI can hold auditors accountable

More than a year and a half after the Satyam scandal hit headlinesSEBI finally has the authority to question auditors of listed companies and proceed against them. Previously, the regulation of auditors was only through the Institute of Chartered Accountants of India. But the Bombay High Court has now upheld SEBI's powers to issue show-cause notices to auditors like PWC, KMPG, Deloitte etc. If suspected, they will need to appear in court and defend their actions. If they are unable to do so, remedial action can be taken against them.

Auditors have a direct, fiduciary relationship with shareholders. They need to make sure that the books of accounts they audit are clean. Giving SEBI the jurisdiction to question these auditing companies will help protect the interests of investors in these companies' shares. And prevent future scams and shams like Satyam's. 

Bonuses are back on Wall Street

The financial sector, responsible for the entire global meltdown has somehow recovered faster than the broader US economy. Wall Street bonuses are likely to be back again this year, despite huge regulatory concerns. Taxpayers' funds were used to bail out this sector in 2008. Yet huge bonuses were doled out to executives, causing public uproar. 

In spite of all of this, some sections of Wall Street will see bonuses rise by up to 15% in 2010. Others could however see a 15% drop. Businesses most likely to see big bonuses include brokerages, equity based asset management. But, fixed-income units at investment and commercial banks and equities are likely to see a bonus decline. Let's hope the regulators come out with rules soon that give shareholders a say in executive compensation. 

Food inflation back to double digits

Perhaps the single most pressing economic problem that the Indian government faces today is that of rising prices. Especially the rise in food articles. It is especially important because it affects the middle class and the poor a great deal. There were some signs of relief for a few weeks. Alas, that was not to last. As the chart of the day show, food inflation is back in the double digits. The figures for individual food items are even more worrying. The price of pulses is up 20.7% YoY, rice 6.9% YoY, wheat 7.9% YoY, cereals 7% YoY and milk 19% YoY for the week ending 31st July, 2010. Clearly the headaches of the government are far from over. 

Tata group's succession efforts sets the right example

Of late there has been a lot of comparison between the top business leaders in India with those of the West, especially the US. With good reason. Firstly, India businessmen lag behind their US counterparts when it comes to charity. Secondly, and more importantly for investors, they tend to restrict the upper echelons of management to only their family members. We have very few Indian examples like the Rothschilds, Rockefellers and Vanderbilts, who gave up management. 

But that seems to be changing. And the example is being set by the best known Indian business house of them all - the Tatas. Ratan Tata, who is due to retire by the next fiscal year, has indicated that he is open to looking at a successor beyond his family. This is an important development for Indian investors because it shows the maturing of India Inc. Large Indian companies have long been marred by succession issues and infighting over ownership of the family jewels. The uncertainty and acrimony only hurts the interests of shareholders who end up as hapless bystanders in such important matters. Hence, we hope more and more family run businesses take a cue from Mr. Tata and become rational about management competence. The interests of the company and its shareholders must take precedence over family ties. That would provide an additional assurance for the small investor to buy into such companies. 

CUP AND HANDLE PATTERN

The cup and handle pattern is a bullish continuation formation. This pattern is one of the newer chart formations and can be easily spotted on a price chart. The formation was first popularized by William O'Neil in his 1988 book, How to Make Money in Stocks. In order for the cup and handle setup to have the highest odds of succeeding, it should come after a clear uptrend is in place. The chart patternconsists of two key components: (1) cup and (2) handle.

Cup

After a new high is set with an increase in volume, the asset will then begin an extended pullback. This pullback will occur on light volume and create a rounding bottom. Relative to the time it took to make the first high, the rounding bottom will take three to four times induration to complete. Throughout this bottoming process, you will notice that the volume will diminish. In order for the odds of the cup and handle to be in your favor, the cup should not retrace more than 50% of the prior up move. There are times that the formation will work with retracements of 61.8% or greater, but the odds are no longer in your favor. Once this intermediary low is in, the asset will begin to rally back up to the last swing high, only to fail at the retest level.

Handle

The handle begins to form after the failed retest of the swing high. The asset will then retrace roughly 38.2% to 50% of the cup. The smaller the retracement, the greater odds of success. Once the handle completes this minor correction, it will then breakout above the two recent swing highs, with an increase in volume. The target of the cup and handle formation is calculated by adding the depth of the cup to the breakout level.

CUP AND HANDLE CHART EXAMPLE

The below example is from Sirius Satellite Radio in late '04. Notice how the cup and handle called for the massive breakout, too bad the public had to wait until Howard Stern announced he was coming over to satellite before they were able recognize the strength in the stock.