How To Trade In Equity ?

Here you will get the Basic Methods of Trading in Equites & Bonds, which are supported by well known Equity Trading Guru.

Have You Joined This Blog ?

Please Join This Blog, Before Leaving , It will Make this Blog Reachable to Others Investors. Please Refer This Blog to Your Friends Also.

Friday, April 22, 2011

McGinley Dynamic-The Most Reliable Indicator You've Never Heard Of by Brian Twome


John R.McGinley is a Certified Market Technician, former editor of the Market Technicians Assn. Journal of Technical Analysis and inventor of the McGinley Dynamic. Working within the context of moving averages throughout the 1990s, McGinley sought to invent a responsive indicator that would automatically be more responsive to the raw data than simple or exponential moving averages.
SMA Vs. EMA
Simple moving averages (SMA) smooth out price action by calculating past closing prices and dividing by the number of periods. To calculate a 10-day simple moving average, add the closing prices of the last 10 days and divide by 10. The smoother the moving average, the slower it reacts to prices. A 50-day moving average moves slower than a 10-day moving average. A 10- and 20-day moving average can at times experience a volatility of prices that can make it harder to interpret price action. False signals may occur during these periods, creating losses because prices may get too far ahead of the market.
An exponential moving average (EMA) responds to prices much more quickly than a simple moving average. This is because the EMA gives more weight to the latest data rather than the older data. It's a good indicator for the short term and a great method to catch short term trends which is why traders use both simple and exponential moving averages simultaneously for entry and exits. Nevertheless it too can leave the data behind.
The Problem with Moving Averages
In his research of moving averages which went much further than the basic examples already shown, McGinley found moving averages had many problems. The first problem was they were inappropriately applied. Moving averages in different periods operate with varying degrees in different markets. For example, how can one know when to use a 10-day to a 20- to a 50-day moving average in a fast or slow market. In order to solve the problem of choosing the length of the moving average that applies to the current market, the McGinley Dynamic automatically adjusts itself to the speed of the market.
McGinley believes moving averages should only be used as a smoothing mechanism rather than a trading system or signal generator. It is a monitor of trend. But a 10-day simple moving average is off by five days or half its length. Chances are good that the big move in prices already occurred by the fifth day of a 10-day simple moving average. In addition, a 10-day moving average should properly be plotted five days before the present datum.
Further, McGinley found moving averages failed to follow prices since large separations frequently exist between prices and moving average lines. McGinley sought to eliminate these problems by inventing an indicator that would hug prices more closely, avoid price separation and whipsaws and would follow prices automatically in fast or slow markets.
McGinley Dynamic
This he did with the invention of the McGinley Dynamic. The formula is:
MD = MD-1 + (Index – MD-1) / (N * (Index / MD-1 ) 4)
The McGinley Dynamic looks like a moving average line yet it is a smoothing mechanism for prices that turns out to track far better than any moving average. It minimizes price separation, price whipsaws and hugs prices much more closely. And it does this automatically as this is a factor of the formula. Because of the calculation, the Dynamic Line speeds up in down markets as it follows prices yet moves more slowly in up markets. One wants to be quick to sell in a down market, yet ride an up market as long as possible. The constant N determines how closely the Dynamic tracks the index or stock. If one is emulating a 20-day moving average, for instance, use an N value half that of the moving average or in this case 10.
It greatly avoids whipsaws because the Dynamic Line automatically follows prices in any market fast or slow, it's like a steering mechanism that stays aligned to prices when markets speed up or slows down. It can be relied upon for trading decisions yet McGinley invented the Dynamic in 1997 as a market tool rather than as a trading indicator.
Conclusion
Whether it is called a tool or indicator, the McGinley Dynamic is quite a fascinating instrument invented by a market technician that has followed and studied markets and indicators for nearly 40 years.

Saturday, April 16, 2011

Context Is Everything by Gil Morales and Chris Kacher


You do not have to be a Chartered Market Technician to understand how market context can influence the price behavior of stocks. No stock is an island, and how a stock behaves is often a function of the market at large, which in turn is a function of underlying conditions — the context within which any particular market environment is developing.
In the simplest of terms, we know that in a bull market, most stocks go up, and in a bear market, most stocks go down, so this basic idea that market context can provide meaningful clues when studying stock charts is already something we are familiar with when we speak of bull and bear market environments.
It’s the context
While the use of stock charts can be very complex, often the exercise of comparing the price behavior of a stock to a chart of the market as represented by, for example, a major market index such as the Nasdaq Composite Index or the Standard & Poor’s 500 can help you understand a stock’s potential strength. You are also able to better understand why certain price movements are evident in a stock’s overall price chart. When it comes to understanding the price/volume behavior of stocks, context is everything.
A CUP WITH A JAGGED HANDLE. The  Nifty-Spot came down in a series of three very sharp waves. As the Nifty was approaching a top in Jan 2011 at point 1, SCHW was attempting to emerge from a sideways consolidation on brisk volume. Note the powerful countertrend move in SCHW when the Nifty-Spot bottoms at point 4. This could be the deciding factor in purchasing shares of SCHW.

Putting A Stop To It by David Garrard


Investors and traders alike devote a considerable amount of time focusing on what investments to make and what tools to use to make these investments. Novices often spend very little time planning the exit strategy. This is the key difference between seasoned traders and novices. In fact, a greater focus on the exit and less on the entry might make the real difference in your overall trading effectiveness.
Why use stops?
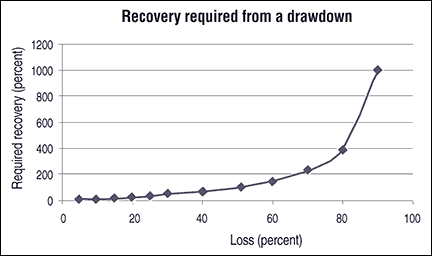
When a loss is posted, we always measure it relative to our original holdings. A similar measure is calculated when a profit is posted. It is important to understand the asymmetry built into a loss/win cycle. Figure 1 shows that if you post a loss of 10%, it will take a percentage gain of 11.1% to recover. Okay, you can live with that as a recovery target. So what happens if you post a loss of 30%? It requires a recovery of 43% above your present net holdings to get back to your original account value. What happens if you lose 80% of your holdings? Well, that will require a 400% price move to recover your losses — not much chance of that in today’s markets. The lesson here is to cut your losses early. That is where the proficient use of stop alerts comes in.
Consistently deploying stops can be painful, but it will allow you to know the maximum limit of your loss in advance, moving you away from later stage fear–based decision-making that can occur when a trade goes against you. It’s already been decided in your trading plan; you exit with a controlled loss.
Image 1
FIGURE 1: RECOVERY FROM A DRAWDOWN. A loss of 10% will take a percentage gain of 11.1% to recover. A loss of 30% requires a recovery of 43%. A loss of 80% of your holdings requires a 400% price move to recover your losses.

Investment Candles by Thomas N. Bulkowski


Investment-grade candlesticks work as reversal or continuation patterns at least two-thirds of the time (66%), and they are plentiful. By “plentiful,” I mean that I sorted a list of 103 candlestick patterns by how often they appeared in the Standard & Poor’s 500 from August 1996 to August 2006. I split the list and discarded the rare ones. That left just 13 candle types, which I describe here.
Configuration and definition
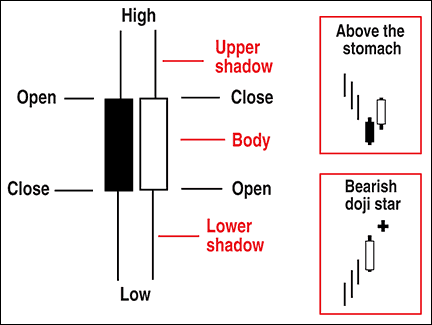
Before I discuss the performers, let’s review the configuration. Figure 1 shows two candlesticks, one black and the other white. The price bar’s high is at the top of the candle, and the low is at the bottom. Between those two extremes are the opening and closing prices, the order of which determines the candle body’s shade. The thin bars at either end are the shadows or wicks, with a body sandwiched in between. A candle need not have a shadow, and the body can be a flat line as in a four-price doji. In those situations, all four prices are the same.
Image 1

VOLUME ZONE OSCILLATOR


In The Volume Zone,” authors Walid Khalil and David Steckler present a new volume zone oscillator that can be easily implemented using AmiBroker Formula Language. A ready-to-use formula for the indicator can be found below.
To use the code, enter the formula in the Afl Editor, then press “Insert indicator.” To modify the averaging period of the volume zone oscillator, right-click on the chart and select “Parameters” from the context menu.


Thursday, April 14, 2011

Hines Ratio

A modified put/call ratio that refines traditional option ratio analysis by including the open interest figures in the equation and can be defined as (Total put volume/Total put open interest) divided by (Total call volume/Total call open interest)

Adaptive Filter

Smoothing and/or forecasting prices with continuously updated weighting of past prices. 

ADA

Block-structured programming language developed under the guidance of the U.S. Department of Defense to provide a medium for writing real-time, concurrent applications, for facilitating program verification. 

Accumulation

An addition to a trader's original market position. The first of three distinct phases in a major trend in which investors are buying. 

ABC

Elliott wave terminology for a three-wave countertrend price movement. Wave A is the first price wave against the trend of the market. Wave B is a corrective wave to Wave A. Wave C is the final price move to complete the countertrend price move. Elliott wave followers study A and C waves for price ratios based on numbers from the Fibonacci series. 

Abandoned Baby Pattern


A rare candlestick pattern in which an upside gap doji star (where the shadows do not touch) is followed by a downside gap black candlestick where the shadows also do not touch; considered a major top reversal signal. 


A Priori

Known ahead of time

Free Cash Flow of the Firm-Why It matters to Investors ?


Free Cash Flow presents a more accurate picture of the financial health of a Company .It allows the company to pursue opportunities that ultimately enhance shareholder value, such as develop new products, acquire firms and pay-off debt. Companies with high free cash flows provide stable returns and tend to out-perform during uncertain times. They are also likely to pay rich dividends to the Shareholders.
If a Firm is increasing its cash flow steadily every year, it usually indicates that it is running its operations efficiently by reducing cost or expanding its market share.
 TEN Indian Companies (NSE Listed) with highest Free Cash Flow-
1.ONGC 2.COAL INDIA 3.INFOSYS 4.NMDC 5.HINDUSTAN ZINC 6.SAIL 7.WIPRO 8.HUL 9.TATA STEEL 10.TCS

Monday, April 11, 2011

Top 10 Mistakes Traders Make - by Jim Wyckoff


Achieving success in futures trading requires avoiding numerous pitfalls as much, or more, than it does seeking out and executing winning trades. In fact, most professional traders will tell you that it's not any specific trading methodologies that make traders successful, but instead it's the overall rules to which those traders strictly adhere that keep them "in the game" long enough to achieve success.
Following are 10 of the more prevalent mistakes I believe traders make in futures trading. This list is in no particular order of importance.
1. Failure to have a trading plan in place before a trade is executed. A trader with no specific plan of action in place upon entry into a futures trade does not know, among other things, when or where he or she will exit the trade, or about how much money may be made or lost. Traders with no pre-determined trading plan are flying by the seat of their pants, and that's usually a recipe for a "crash and burn."
2. Inadequate trading assets or improper money management. It does not take a fortune to trade futures markets with success. Traders with less than $5,000 in their trading accounts can and do trade futures successfully. And, traders with $50,000 or more in their trading accounts can and do lose it all in a heartbeat. Part of trading success boils down to proper money management and not gunning for those highly risky "home-run" type trades that involve too much trading capital at one time.
3.Expectations that are too high, too soon. Beginning futures traders that expect to quit their "day job" and make a good living trading futures in their first few years of trading are usually disappointed. You don't become a successful doctor or lawyer or business owner in the first couple years of the practice. It takes hard work and perseverance to achieve success in any field of endeavor--and trading futures is no different. Futures trading is not the easy, "get-rich-quick" scheme that a few unsavory characters make it out to be.
4.Failure to use protective stops. Using protective buy stops or sell stops upon entering a trade provide a trader with a good idea of about how much money he or she is risking on that particular trade, should it turn out to be a loser. Protective stops are a good money-management tool, but are not perfect. There are no perfect money-management tools in futures trading.
5.Lack of "patience" and "discipline." While these two virtues are over-worked and very often mentioned when determining what unsuccessful traders lack, not many will argue with their merits. Indeed. Don't trade just for the sake of trading or just because you haven't traded for a while. Let those very good trading "set-ups" come to you, and then act upon them in a prudent way. The market will do what the market wants to do--and nobody can force the market's hand.
6.Trading against the trend--or trying to pick tops and bottoms in markets. It's human nature to want to buy low and sell high (or sell high and buy low for short-side traders). Unfortunately, that's not at all a proven means of making profits in futures trading. Top pickers and bottom-pickers usually are trading against the trend, which is a major mistake.
7.Letting losing positions ride too long. Most successful traders will not sit on a losing position very long at all. They'll set a tight protective stop, and if it s***they'll take their losses (usually minimal) and then move on to the next potential trading set up. Traders who sit on a losing trade, "hoping" that the market will soon turn around in their favor, are usually doomed.
8."Over-trading." Trading too many markets at one time is a mistake--especially if you are racking up losses. If trading losses are piling up, it's time to cut back on trading, even though there is the temptation to make more trades to recover the recently lost trading assets. It takes keen focus and concentration to be a successful futures trader. Having "too many irons in the fire" at one time is a mistake.
9.Failure to accept complete responsibility for your own actions. When you have a losing trade or are in a losing streak, don't blame your broker or someone else. You are the one who is responsible for your own success or failure in trading. You make the trading decisions. If you feel you are not in firm control of your own trading, then why do you feel that way? You should make immediate changes that put you in firm control of your own trading destiny.
10. Not getting a bigger-picture perspective on a market. One can look at a daily bar chart and get a shorter-term perspective on a market trend. But a look at the longer-term weekly or monthly chart for that same market can reveal a completely different perspective. It is prudent to examine longer-term charts, for that bigger-picture perspective, when contemplating a trade.


Saturday, April 9, 2011

Housing Shortage Stands Out Among Bahrain's Woes


As anti-government protests continue in Bahrain, recent Gallup surveys indicate a lack of affordable housing is among the most prominent sources of economic concern for the country's population. In October 2010, 41% of nationals and Arab expatriates surveyed in Bahrain said there had been times in the past 12 months when they did not have enough money to pay for adequate shelter -- a sharp rise from 24% in March 2009.
housing over years.gif
Protesters in Bahrain have demanded political reform and a more representative government in demonstrations that started Feb. 14. While press coverage has focused largely on possible sectarian tensions between the country's Shiite majority and Sunni minority, Gallup polling suggests people in the country have other key grievances. Economic concerns, such as access to food and shelter, are also important. The country does not have as much oil wealth as other small Arab Gulf countries.
In some cases, the Bahraini government has not been able to maintain the extensive social services and employment opportunities that several neighboring populations enjoy -- particularly since the region began experiencing a demographic "youth bulge." Consequently, relative to other small Arab Gulf countries, a larger share of respondents in Bahrain have a hard time paying for basic necessities; for example, in late 2010, 22% of those surveyed said there had been times in the past 12 months when they did not have enough money to buy the food they or their families needed. By contrast, 9% of respondents in Kuwait and 6% in the United Arab Emirates said the same.
When it comes to services that the government traditionally subsidizes, the country's housing shortage is a particularly sore spot for people in Bahrain. The 41% of adults surveyed in Bahrain who said there were times in the past 12 months when they did not have enough money to provide adequate housing tops all other populations surveyed in the Arab League.
housing Arab Gulf countries.gif
These results reflect the growing severity of Bahrain's housing shortage as its young adult population has swelled. According to the country's housing ministry, more than 46,000 people are currently on the waiting list for government-subsidized housing, and housing units are now being assigned to those who applied in 1993.
Rising concerns about housing are also evident in respondents' relatively low satisfaction with the availability of good, affordable housing in their city or area. One in three respondents (33%) in Bahrain in April 2010 said they were satisfied -- down dramatically from 61% in March 2009. As in the other Arab Gulf countries surveyed in 2010, the availability of good, affordable housing is the one aspect of their communities that respondents were least likely to be satisfied with. However, people in Bahrain were significantly less likely to be satisfied with local housing availability than those in Kuwait, Saudi Arabia, or the United Arab Emirates.
Addressing the housing crisis may go a long way toward improving the outlook of those in Bahrain, particularly because satisfaction with other important services -- including education and healthcare -- remains strong.
city or area Arab Gulf countries.gif
Bottom Line
The Bahraini government has recently started to explore new strategies for improving housing availability, most prominently public-private partnerships. Until the country's property bubble burst in 2008, private developers were focused on building luxury housing rather than units that were affordable to most Bahrainis. That is now changing as the demand for high-end housing has dropped. On March 9, the government announced a plan to build 50,000 homes over the next five years in cooperation with the private sector -- a move Housing Minister Majid Al Alawi hoped would "contribute to forwarding the national dialogue" between the government and opposition leaders.
For complete data sets or custom research from the more than 150 countries Gallup continually surveys, please contact SocialandEconomicAnalysis@gallup.com or call 202.715.3030.
About the Abu Dhabi Gallup Center
Building on Gallup's seminal work in the field of Muslim studies, the Abu Dhabi Gallup Center offers unmatched research on the attitudes and aspirations of Muslims around the world. Learn more.
Survey Methods
Results from Bahrain are based on face-to-face interviews with approximately 1,000 adults, aged 15 and older, per survey wave. The sample includes Bahrainis and Arab expatriates; non-Arabs were excluded. It's estimated that approximately one-fourth of the adult population is excluded. For results based on this total sample, one can say with 95% confidence that the maximum margin of sampling error is ±3.1 percentage points. The margin of error reflects the influence of data weighting. In addition to sampling error, question wording and practical difficulties in conducting surveys can introduce error or bias into the findings of public opinion polls.

Saturday, April 2, 2011

2010-2011: Total market wealth at D-street shot up to 68 lakh crore


NEW DELHI: Last fiscal that saw the total market wealth grow by over Rs 6.73 lakh crore. However, the gains during the fiscal ended March 31 were just about one-fifth of the same during the previous fiscal -- both for the overall market and public investors. 

The total market wealth, measured in terms of the cumulative value of all listed stocks in the country, grew to Rs 68,39,082.89 crore at the end of fiscal ended March 31, 2011. 

The figure stood at Rs 61,65,620.14 crore at the end of the previous fiscal, taking the total gain for the fiscal 2010-11 to Rs 6,73,462.75 crore. 

However, the share of public shareholders was only about Rs 1,00,000 crore out of this gain, given an average public holding of less than 15 per cent in listed companies. The remainder of about Rs 5,73,000 crore was shared by other shareholder classes, such as promoters. 

The fiscal, beginning April 1, 2010, and ending on March 31, 2011, had a total of 255 trading days, during which trading was conducted in the stock market for a total of 99,450 minutes, given an average of 6.5 hours of trade a day. 

For the overall market, every minute of trade added Rs 6.77 crore to the value of stocks held by all classes of investors. 

In percentage terms, the gains were not much for the stock market, as its benchmark indices, the Sensex and Nifty, grew by about 10 per cent and 12 per cent, respectively. 

The gain in total market wealth, at Rs 6,73,462.75 crore, also stood at a little below 11 per cent. 

This is sharply lower in comparison to the previous fiscal ended March 31, 2010, when the market wealth had nearly doubled, with a surge of about 99 per cent. 

In value terms, the gain in market wealth during 2009-10 stood at about Rs 30,80,000 crore -- nearly five times the gain in the financial year ended yesterday. 

Growth was higher than the latest fiscal in the financial years 2007-08, 2006-07, 2005-06, 2004-05, 2003-04 and 1999-2000 as well. On the other hand, losses were recorded during fiscal years 2008-09, 2002-03 and 2000-01. 

The major gainers for the last fiscal included Tata Motors , TCS, Bajaj Auto, ITC, SBI, M&M, HCL Tech , HDFC and Infosys. 

Furthermore, HDFC Bank , HUL , ICICI Bank , Cairn Energy , Bharti Airtel, BPCL, GAIL, PNB, Wipro and ONGC also moved higher. 

On the other hand, JP Associates , Sesa Goa, RCOM, SAIL, Reliance Infra, Reliance Capital , Sterlite Industries , Hero Honda , DLF , BHEL, Grasim, Reliance Power , Maruti, NTPC, Reliance Industries and Tata Steel lost value.

Tinplate spurts on becoming Tata Steel arm

Investors were seen flocking to the counter of Tinplate Co of India, after the company became a subsidiary of Tata Steel with the conversion of fully convertible debentures held by the latter. 

The shares of the country's largest manufacturer of tinplate, which is used for canning and packaging goods, spurted nearly 13% to 72.8 on significantly higher volumes on Friday. A total of 17.5 lakh shares changed hands compared with the two-week average of 1.2 lakh shares on the BSE. 

The conversion of the FCDs has resulted in the increase in Tata Steel's holding from 42.9% to 59.5%. Becoming the Tata Steel subsidiary will help boost the prospects of Tinplate Co, as it will have access to raw material and would also benefit from better technology and managerial capabilities of the Tata group flagship company, according to analysts. 

Source- http://economictimes.indiatimes.com/markets/stocks/stocks-in-news/tinplate-spurts-on-becoming-tata-steel-arm/articleshow/7848923.cms

Investors gained Re 1 per minute in FY 2010-11

MUMBAI: An average of one rupee was added to the stock market wealth of each public investor in every minute of trade during the last fiscal- a period that saw the total market wealth grow by over Rs 6.73 lakh crore. 

However, the gains during the fiscal ended March 31 were just about one-fifth of the same during the previous fiscal-both for the overall market and public investors. 

Meanwhile on Friday, benchmarks ended lackluster session marginally in the red as bulls ran out of steam after eight-day long winning streak. Buying activity was seen in broader markets as the investors turned focus on midcaps and smallcaps after sharp rise in frontline stocks. 

According to experts, the market may witness some upmove in the short-term on the back of dollar inflows from foreign institutional investors but rising crude oil prices and inflation worries may play spoil sport. 

"During the past two weeks, FIIs have pumped in close to $2 billion surprising even the most optimistic investor. The Indian markets had underperformed the global peers and were reasonably valued, which may have attracted FII interest. However, the fundamental concerns relating to inflation and interest rates still persist, leading to doubts over the durability of this rally. 

In the short-term, it is likely that the markets may take a breather after strong rally. But if the momentum in FII flow remains strong, then we may even see higher levels in the coming week. In all probability, we expect the action to shift to mid and small cap companies that have been severely de-rated in the past few months. 

We continue to maintain favourable view on IT, media and banking. We also remain positive on a longer term over capital goods and infrastructure," said Sanjeev Zarbade, Vice President (Private Client Group Research), Kotak Securities. 

Bombay Stock Exchange's Sensex closed at 19420.39, down 24.83 points or 0.13 per cent. The 30-share index touched a high of 19562.55 and low of 19382.35 in today's trade. 

National Stock Exchange's Nifty ended at 5826.05, down 7.70 points or 0.13 per cent. The broader index touched a high of 5860.20 and low of 5810.40 intraday. 

BSE Midcap Index was up 1.59 per cent and BSE Smallcap Index rallied 2.23 per cent. 

Amongst the sectoral indices, BSE Realty Index was up 2.60 per cent, BSE Metal Index gained 1.15 per cent and BSE Power Index moved 0.93 per cent higher. BSE Bankex was down 0.83 per cent, BSE Oil&gas Index was down 0.59% and BSE IT Index slipped 0.47 per cent. 

Punjab National Bank (-2.79%), HCL Tech (-2.44%), NTPC (-2.25%), State Bank of India (-1.57%) and Kotak Bank (-1.50%) were the top Nifty losers. 

Reliance Capital (5.36%), IDFC (3.95%), Reliance Communications (3.76%), Jaiprakash Associates (3.13%) and Power Grid Corporation (3.09%) were the top gainers. 

Market breadth was positive on the NSE with 2186 advances against 695 declines.

Source- http://economictimes.indiatimes.com/markets/stocks/market-news/investors-gained-re-1-per-minute-in-fy-2010-11/articleshow/7844236.cms