It is important to note that if the user does not attempt to understand how prices move, then applying any indicator is a haphazard affair. Indicators tend to be developed by trial and error, and without a clear understanding of how they work, using them can lead to disappointing -- and disastrous -- results.

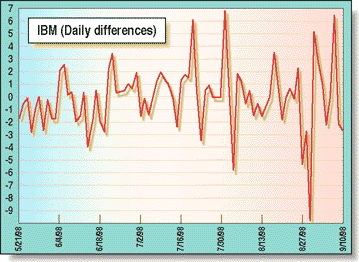
STOCK PRICE MOVEMENTThe point-to-point movement model is based partly on the one put forward by analyst J.M. Hurst a number of years ago and partly on my own research. In this model, stock movement is considered to be composed of random point-to-point movement and complex cyclic movement. Point-to-point movement is simply a generalization of the sampling interval and refers to the change between one data point and the next, such as "tick-to-tick," "day-to-day," and "week-to-week," as well as others.FIGURE 1: DAILY DIFFERENCES. The differences between one day's closing price and the next is plotted for IBM stock over a four-month period.
POINT-TO-POINT MOVEMENT
Point-to-point movement is easily extracted from stock data by most technical analysis programs. An indicator is usually available that will give the difference between successive points; if not, such an indicator can often be created within the program. As an alternative, stock price data can be imported into a spreadsheet and the successive differences calculated and plotted. This method is useful, since a spreadsheet function will be available to determine the standard deviation of these differences, a valuable quantity that will be discussed later.
The point-to-point differences can have negative, positive, or zero (no change from the previous point) values. A plot of these daily differences over a short period can be seen in Figure 1. The vertical grids are spaced at 10-day intervals, and the vertical scale is in dollars. A sequence of changes in the same direction is indicated by the plot remaining on the same side of the zero line.
A close inspection of the differences reveals that the longest such sequence occurred between June 18 and July 2, 1998, and extended to eight successive rises. The extreme peaks and troughs have no meaning other than they are the maximum changes recorded. In general, a sequence of more than 10 successive moves in the same direction in a stock almost never occurs.


No comments:
Post a Comment